|
frozenComp()
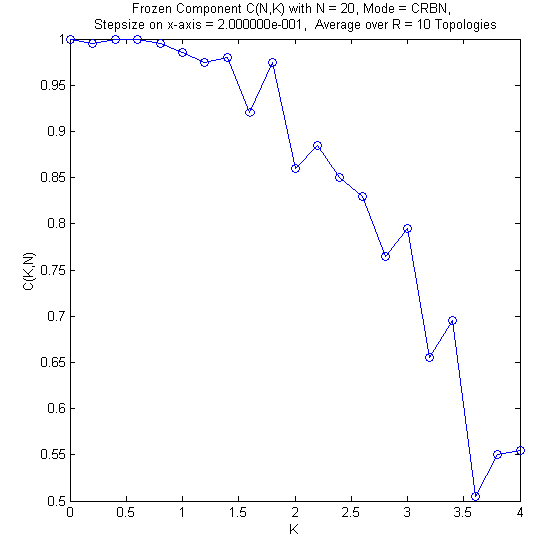
Visualize frozen components graph ([SP1]).
Syntax
[x, y] = frozenComp(kMax, n, r, step, mode)
Description
frozenComp(kMax, n, r, step,
mode) visualizes ratio of frozen components for K=0 to kMax using steps of size
step. Each ratio is an average over r randomly chosen networks with
n nodes being evolved in mode update-scheme.
Input:
kMax - Maximum value for K on the x-axis.
n - Number of nodes
r - Number of networks to evaluate to form average
step - Step size on x-axis (K-axis)
mode - String defining update scheme. Currently supported modes are:CRBN, ARBN, DARBN, GARBN, DGARBN
Output:
x - Values of K for which c(k,n) has been calculated
y - c(k,n)
Example
The following command displays
the frozen component graph with parameters: kMax=4, n=20, r=10,
step=0.2 and mode='CRBN';
>> [x, y] = frozenComp(4,50,2,0.2,'CRBN')

See also
evolveARBN(),
evolveDARBN(), evolveGARBN(),
evolveDGARBN(), evolveCRBN(),
evolveTopology(), findAttractor(),
countTransitionsPerNode()
|